As our most popular service offering, this track provides the foundation for effectively analyzing data in financial and related industries. Participants will learn to apply a broad range of data analysis, including graphical and statistical techniques to assess if processes are on target, relationships between variables, and how to minimize defects using examples with metrics such as time, ratings, and revenue. Analytical and statistical principles will be presented through real-world examples and exercises.
This course is appropriate for individuals at any services organization who wish to leverage the power of predictive analytics to solve problems. The course is popular among business analysts, members of a problem-solving team, those leading and facilitating process improvement activities (such as Lean Six Sigma or operational excellence), marketing analysts, and practitioners preparing to adopt process improvement in their service organization.
Training Track
- Minitab Essentials for Service Quality
- Statistical Modeling for Service Quality
- Statistical Quality Analysis for Service Quality
- Workshop
DAY 1-2
In this 2-day foundational course you will learn to minimize the time required for data analysis by using Minitab to import data, develop sound statistical approaches to exploring data, create and interpret compelling graphs, and export results. Analyze a variety of real world data sets to learn how to align your applications with the right statistical tool, and interpret statistical output to reveal problems with a process or evidence of an improvement. Learn the fundamentals of important statistical concepts, such as hypothesis testing and confidence intervals, and how to uncover and describe relationships between variables with statistical modeling tools.
This course places a strong emphasis on making sound decisions based upon the practical application of statistical techniques commonly used in business, transactional, and services processes.
Topics Include:
- Importing and Formatting Data
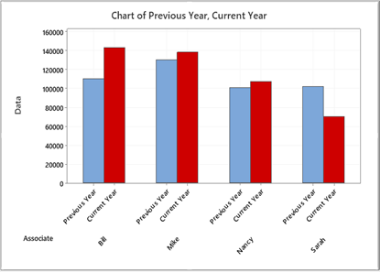
- Bar Charts
- Histograms
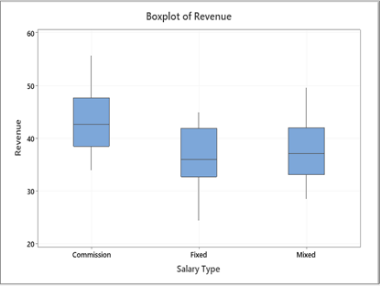
- Boxplots
- Pareto Charts
- Scatterplots
- Tables and Chi-Square Analysis
- Measures of Location and Variation
- t-Tests
- Proportion Tests
- Tests for Equal Variance
- Power and Sample Size
- Correlation
- Simple Linear and Multiple Regression
- One-Way ANOVA
Prerequisites: None