Participants explore the data analysis techniques necessary to understand variation and defects, claim equivalence, conduct multi-vari studies, determine the shelf life, evaluate and certify measurement systems, validate a process is capable of meeting customer specifications, and monitor the stability of a validated process. Emphasis is placed on all applications that will help you make sound business decisions to ensure you are providing the best quality product to your customers. Analytical and statistical principles will be presented through case studies, examples, and exercises.
This course is most appropriate for process engineers, R&D team members, and other quality professionals who need to understand how to apply analytical and statistical tools to a pharmaceutical process.
Training Track
- Minitab Essentials for Pharmaceuticals
- Statistical Quality Analysis for Pharmaceuticals
- Factorial Designs for Pharmaceuticals
- Workshop
DAYS 1-2
In this 2-day foundational course, you will learn to minimize the time required for data analysis by using Minitab! With Minitab, you will practice importing data, developing sound statistical approaches to explore data, creating and interpreting compelling graphs, and finally, exporting results. Discover how to analyze a variety of real-world pharmaceutical data sets to practice aligning your applications with the right statistical tool and interpreting statistical output to reveal problems with a process or evidence of an improvement. Learn the fundamentals of important statistical concepts, such as hypothesis testing and confidence intervals, and how to uncover and describe relationships between variables with statistical modeling tools.
This course places a strong emphasis on making sound decisions based upon the practical application of statistical techniques commonly found in the pharmaceutical industry.
Topics Include:
- Importing and Formatting Data
- Bar Charts
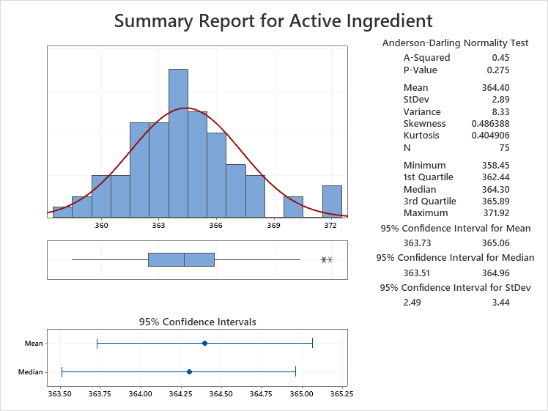
- Histograms
- Boxplots
- Pareto Charts
- Scatterplots
- Tables and Chi-Square Analysis
- Measures of Location and Variation
- t-Tests
- Proportion Tests
- Tests for Equal Variance
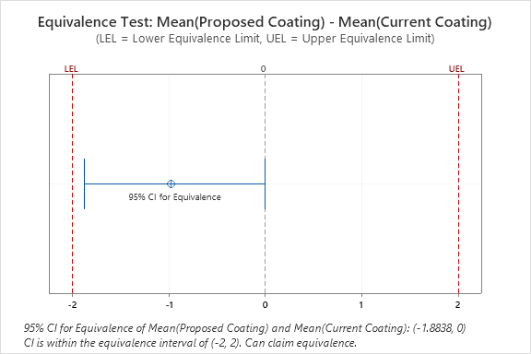
- Equivalence tests
- Power and Sample Size
- Correlation
- Simple Linear and Multiple Regression
- Stability Analysis
- One-Way ANOVA
- Multi-Variable ANOVA
Prerequisites: None