By giving its sales people training and experience using statistical tools, a global leader in the chemical industry created a powerful way to help prospects and customers understand the value of their products and services which, in turn, helped increase sales.
As a global chemical company committed to improving paper production, leathermaking, and water treatment, Buckman is equally committed to continuous improvement within its own business. This philosophy enables the company to deliver exceptional service and innovative chemical solutions that help its customers boost productivity, reduce risk, improve product quality, and provide a measurable return on investment.
Buckman’s unique continuous improvement initiative covers the company’s global operations. As in most deployments, Buckman uses Lean Six Sigma (LSS) and statistics to complete internal improvement projects. But Buckman also trains its technical sales teams to use LSS and statistical tools so they can provide more value to customers. With Minitab Statistical Software to help them analyze their data, Buckman developed new ways to drive sales and transform their business.
The Challenge

Buckman relies on Minitab Statistical Software to help their technical sales teams analyze data and drive sales.
Buckman’s quality initiative began as a response to issues many other companies face.
“We had solid sales growth, but our operating profit was relatively flat,” says Drew Mohler, a Lean Six Sigma black belt and senior organizational development consultant at Buckman. “We were adding activities and costs that superseded any of the benefits we received from increasing sales, so the widening sales versus profit gap became the battle cry for our continuous improvement initiative.”
First, Buckman assessed every role across the organization, with the goal of eliminating non-value added activity.
“That effort caused a paradigm shift in how our organization views the way we do work,” Mohler adds. “It inculcated the company-wide philosophy of always thinking about better, quicker or more cost-efficient ways to do my job.’”
With this mindset in place, the company started structuring a continuous improvement program that used Lean Six Sigma tools as the framework for completing projects across each of its global operations. Mohler, who was responsible for training sales associates on Lean Six Sigma, knew that data analysis skills would be key for teams to successfully complete improvement projects. But this also raised a critical question: who else within the organization would benefit from understanding and using statistical tools?
How Minitab Helped
In many organizations that deploy LSS, statistical tools are taught in either a green or black belt course, as part of a broader toolset that’s framed by the DMAIC methodology, an approach that divides projects into five phases—define, measure, analyze, improve and control. In these deployments, the use of statistical tools is framed solely around working through an improvement project. Buckman chose a different approach, recognizing that the statistical tools of LSS are useful for any role that analyzes data. If these tools were taught independently from the DMAIC model, they could be taught to a broader audience than just green or black belts.
“We took a Lean approach to the deployment of Lean Six Sigma, realizing that many of our associates who should be using statistical tools would not benefit from the full curriculum of a LSS belt course,” says Mohler. “As we looked at this expanded view, we realized that a key group who should be taught these tools were our sales associates.”
At Buckman, technical field sales associates who have backgrounds in chemistry, biology, or engineering work directly with the company’s customers to help them assess their processes and look for improvement opportunities. Analyzing customer data is a key part of Buckman’s selling process.
“Using Buckman’s chemistry solutions, our technical sales teams work to make our customers’ systems better,” Mohler says. “In essence, they function as process engineers for our customers.”
Mohler and his colleagues developed two separate Lean Six Sigma courses. The first course, a yellow belt course, focused on the traditional DMAIC process and the “soft” tools of quality improvement. This is the course Buckman teaches associates who will be leading simple improvement projects. The second course is a data analysis and statistical tools course targeting the organization’s sales associates.
Instead of using the DMAIC framework as the backbone of the statistics training, Buckman took the selling process and linked the appropriate statistical tools to each step. This framework broke the sales flow into more manageable pieces and looked at data analysis activities that are used to:
- Gain knowledge of customer processes
- Plan, run, evaluate and sell new chemical programs
- Manage ongoing chemical programs
- Solve problems within the account
“The end goal is to have our sales associates comfortable using practical statistical tools, so they’ll be able to make better recommendations—data-driven recommendations—to help our customers,” notes Mohler. “We believe that focusing our efforts on improving customer satisfaction will make Buckman more profitable and sustainable.”
In the statistics class, associates are trained on the tools they need for their job activities. Concepts such as control charting, hypothesis testing, capability analysis, and correlation are taught with practical examples that use the data analysis tools available in Minitab Statistical Software.
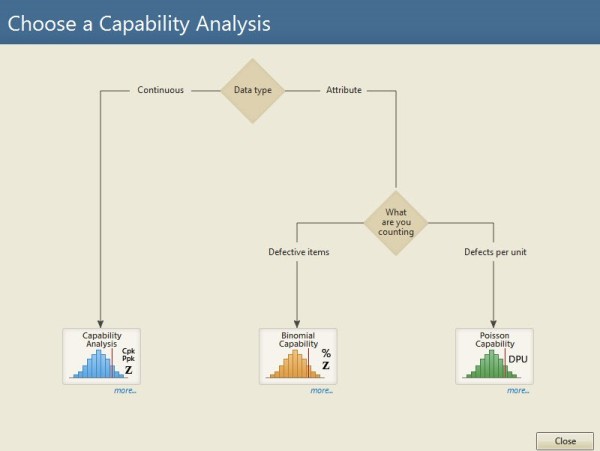
To perform statistical analyses such as process capability—which can help determine whether a process is capable of producing output that meets customer requirements—associates use the Minitab Assistant. The Assistant is a menu-based tool that guides users step-by-step through their analysis. It includes decision trees that make it easy to choose which analysis to use to examine data.

The Assistant outlines the process for choosing the right analysis and includes interactive decision trees that pose questions to help users pick the appropriate statistical tool.
“When learning statistics, the last thing our associates want is something complicated, and they find the decision trees which help them choose which analysis to use to be extremely useful,” Mohler says. “There is an intimidation factor with learning statistics, but not when you’re using the Assistant.”
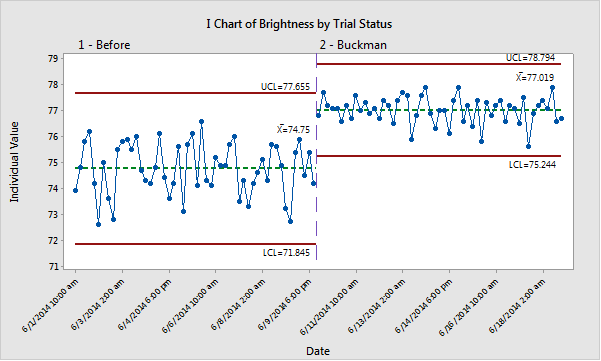
Associates are also taught to visualize their data using Minitab’s various graphs and charts. For example, suppose an associate runs a trial to improve the brightness of paper being produced for one of Buckman’s customers, and collects data both before the trial and during the trial to assess whether their product has made a difference. The staged control chart provides a powerful tool to show the impact that the company’s chemistry had on the process.

The control chart with stages above shows the impact that a product had on the process average.
The sales associates also learned to perform hypothesis tests with the Assistant. Hypothesis tests are used to determine whether there is sufficient evidence in a sample of data to infer a given conclusion for the entire population.
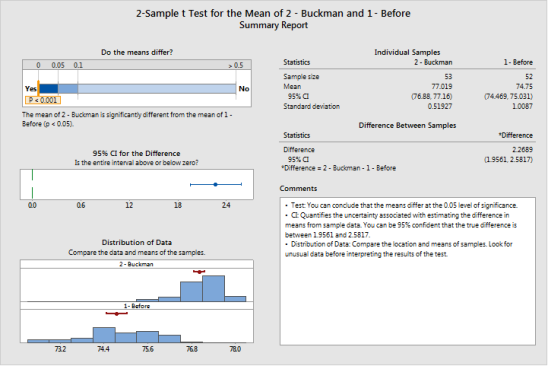
To determine if there was a statistically significant improvement resulting from a Buckman product, associates are taught to run a 2-sample t-test in Minitab to assess the difference between the two means. Instead of simply taking an average of the before and during results and making statements about the trial’s success, associates are taught to use statistical tools to more accurately evaluate the results of a trial.

The Assistant’s summary reports help sales associates draw the correct conclusions from their analyses and explain the results.
The Assistant’s built-in interpretation makes it simple for associates to see if there is a statistically significant difference between the two means, which allows them—and their customers—to verify a trial’s success.
“Minitab has helped us demystify statistics and successfully teach something that’s been perceived as being more complicated than it really is,” Mohler says. “Our sales associates have latched on to data analysis, and they’ve been able to see the benefits first-hand.”
To provide supplementary guidance on learning statistical tools, Mohler and the LSS deployment team made sure the associates had access to Quality Trainer, Minitab’s e-learning course that teaches quality statistics and how to analyze data with Minitab.
“Quality Trainer helps our associates gain an increased understanding of statistical tools, both before and after they attend the training,” says Mohler. “Minitab and Quality Trainer are powerful tools that are easy to learn and use, and we appreciate the training and free technical support resources that are included with our concurrent user licenses.”
Results
Since launching the statistical tools training 3 years ago, Buckman has trained more than 500 field sales associates worldwide. And the results are being noticed by other parts of the company.
“Our Research and Development teams are also interested in learning how to leverage Minitab for the data analysis work they routinely do. We are currently developing classes for them which will focus on analysis tools useful for product development and laboratory testing,” Mohler says. “Our corporate mentality has morphed into an approach that empowers everyone within our organization to make data-driven decisions.”
In another example, an engineer at one of the Buckman plants who wanted to receive Minitab training sat through one of the field sales classes. “He went back to his office between the second and third days of the training and ran a capability study in Minitab,” says Mohler. “He realized the plant could make a slight adjustment to a process parameter for one product that would save over forty thousand dollars a year.”
With their field statistics training, sales associates at Buckman are improving their conversion rates—but more importantly, they are delivering more value for customers.
“Since implementing the field statistics training, we have examples of where we’ve sold new business or protected existing business because of our improved data analysis skills.” notes Mohler. “But what we’ve really seen is increased confidence in our sales associates.
“Because they’ve done the statistical work behind the scenes, they are better prepared to explain the benefits resulting from our products and our customers see us as much more knowledgeable about their systems. This alone makes the training program a success.”
What started as a continuous improvement project at the executive level has quickly infiltrated the rest of the organization.
“We continue to embrace continuous improvement and data-driven thinking and know that this culture is critical to our long-term success,” Mohler says. “We’ve found that anybody that uses data can benefit from Minitab.”

Organization
Buckman
Overview
- Global chemical company specializing in innovative solutions for pulp and paper, leather, and water treatment industries
- Headquartered in Memphis, Tenn.
- More than 1,600 employees
- Customers in more than 90 counties
- Production facilities across the globe
Challenge
Enable technical sales associates to use data to help their customers improve processes—and to improve their own sales success.
Products Used
Minitab® Statistical Software
Quality Trainer®
Results
- Trained more than 500 field sales associates worldwide
- Increased customer satisfaction
- Improved conversion rates for closing business
- Expanded LSS deployment to other business functions within the organization


