


Explore the AI Landscape: Spotlight on Machine Learning
Machine learning is one of the most powerful and well-developed types of AI currently known, and it’s impacting every industry. Minitab provides AI.
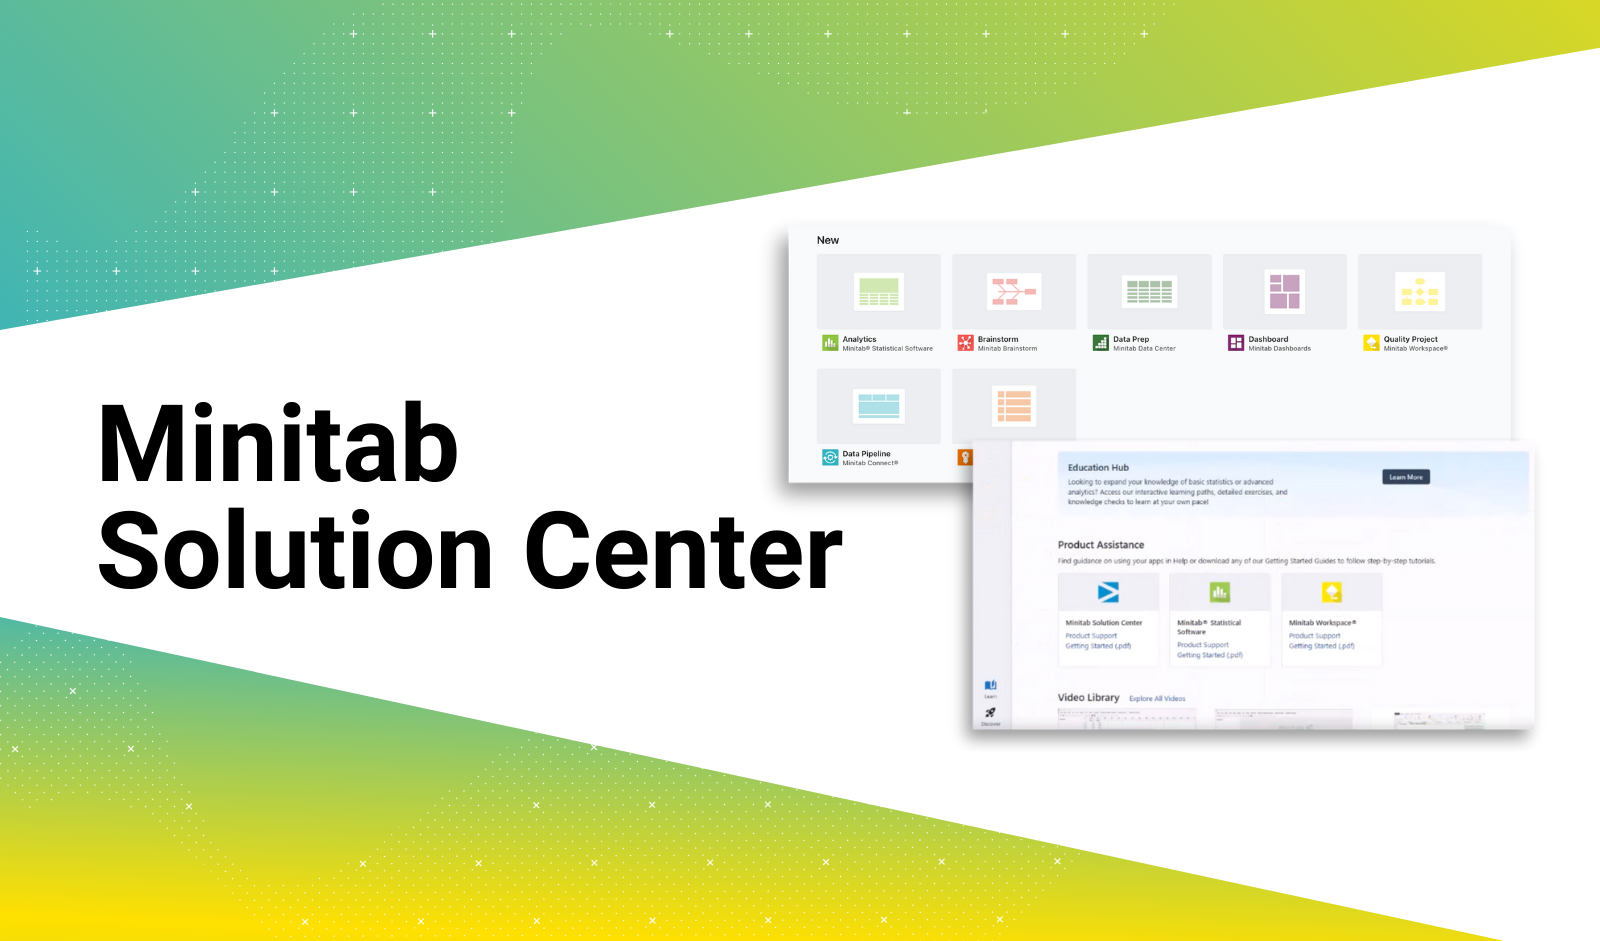
Streamlined Data Management with the Data Center in the Minitab Solution Center
Ensure data quality and streamline data management with the Minitab Data Center. Effortlessly load, visualize, and understand your data using powerful features like Data Grid, Preparation Steps, and Column Metrics. Seamlessly integrate with other Minitab Solutions to enhance your workflow and derive actionable insights.
The Minitab Solution Center: Bridging Data and Decision-Making
The Minitab Solution Center offers integrated, user-friendly tools for complex data analysis and visualization, empowering users to make confident, data-driven decisions. It provides a holistic approach to data analysis, project management, and informed decision-making. Experience seamless data preparation, brainstorming, and intuitive visualizations to enhance your business capabilities. Try it now with a free trial!
From Data to Decisions: How Minitab Dashboards Empower Smarter Business Insights
Discover Minitab Dashboards & learn how industries like manufacturing, healthcare, & finance use Dashboards to track key metrics and improve efficiency.
How Manufacturers Use Minitab Dashboards to Justify Process Improvements & Cut Waste
Manufacturers relying on human inspection face high scrap and rework costs. Learn how Minitab Dashboards help visualize key quality metrics.
Structuring Ideas for Action with Brainstorm in Minitab Solution Center
Transform brainstorming into actionable, data-driven solutions with Brainstorm in Minitab Solution Center.
Why Real-Time SPC is the Key to Seeing—and Solving—Problems Before They Cost You
Discover how Real-Time SPC gives manufacturers the visibility and speed they need to prevent issues before they escalate. Learn how Minitab helps teams improve quality.
Why Manual Reporting is Holding You Back (And How to Fix It)
Struggling with slow, error-prone reporting? Learn how automating reporting processes saves time, reduces inconsistencies, and ensures reliable insights for confident decision-making.
Why Discrete Events Simulation Should Be in Your Research Lab
Discover how Discrete Event Simulation (DES) can transform research lab operations. Learn how labs use DES to optimize workflows, eliminate bottlenecks, and improve resource efficiency.
If My Product Meets Specifications, Why Do I Care if My Process is Capable or Stable?
Why meeting specs isn’t enough—learn why process capability and stability matter for quality.